The answer to this delves into reading the data sheets for the various films.
For Velvia 50, the data sheet can be found here.
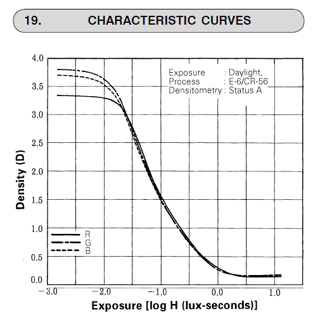
The relevant piece is the characteristic curves:

The horizontal axis is the exposure, in log10 units (note that stops use a log2). As 210 is about 103, the range from -3.0 to 0.0 is 10 stops of light.
The straight line fit for this (from about where it crosses 3.0 on the Y axis) to... lets call it 0.25 at 0 on the X axis is... well, lets call that -1.6.
Now for some math.
101.6 = 2x
some math
x = 5.31
And well, that's about what I'd expect from slide film. Velvia has a bit more, and one can certainly pull a bit more in the greens and blues from the deep dense parts of the film (where red flattens out), but that's what you would expect to get.
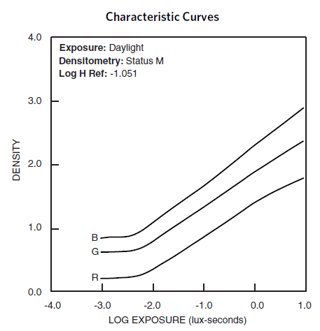
For negative film such as Portra, you would see the curves go the other way.

Here, we see a straight line range from -2 to +1 for a range of 3. That gives us about a 10 stop range. Note here that I'm less familiar with color negative film and how well that film responds with different densities in the negative. There's also the factor of what the print has for a dynamic range (not an issue with the slide).
However, that is an approximation of the dynamic range and how to figure it out for any give film. When you get to black and white, as seen in Tmax data sheets, there are an enormous number of variables - processing time and developer choice can give very different curves to the density of the film.


