It is probably complicated to reply accurately to your question without knowing which parameters have been used to generate the chromaticity diagram. However the following facts remain:
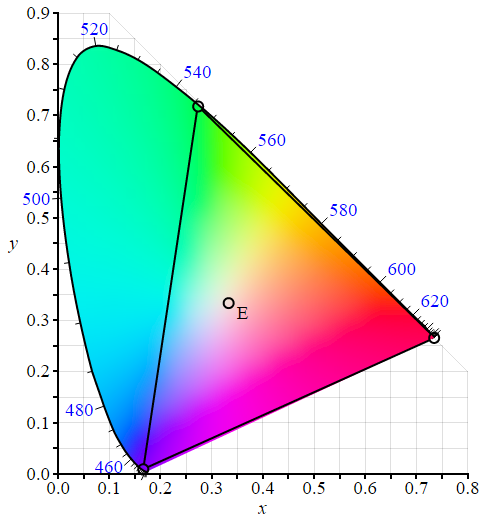
- Your linked chromaticity diagram colours have been altered / blurred to attenuate the discontinuities introduced by conversion from CIE XYZ tristimulus values to sRGB / Rec. 709 colourspace.
- The represented RGB colourspace triangle is actually not sRGB colourspace but CIE RGB colourspace which is entirely different.
- If you were to depict accurately sRGB / Rec. 709 colourspace and use it to generate the chromaticity diagram colours, all the colours outside the triangle would not be represented accurately and would have one or more negative component(s) needing to be normalised and clipped in order to be displayed which is the reason you see them in your linked diagram.
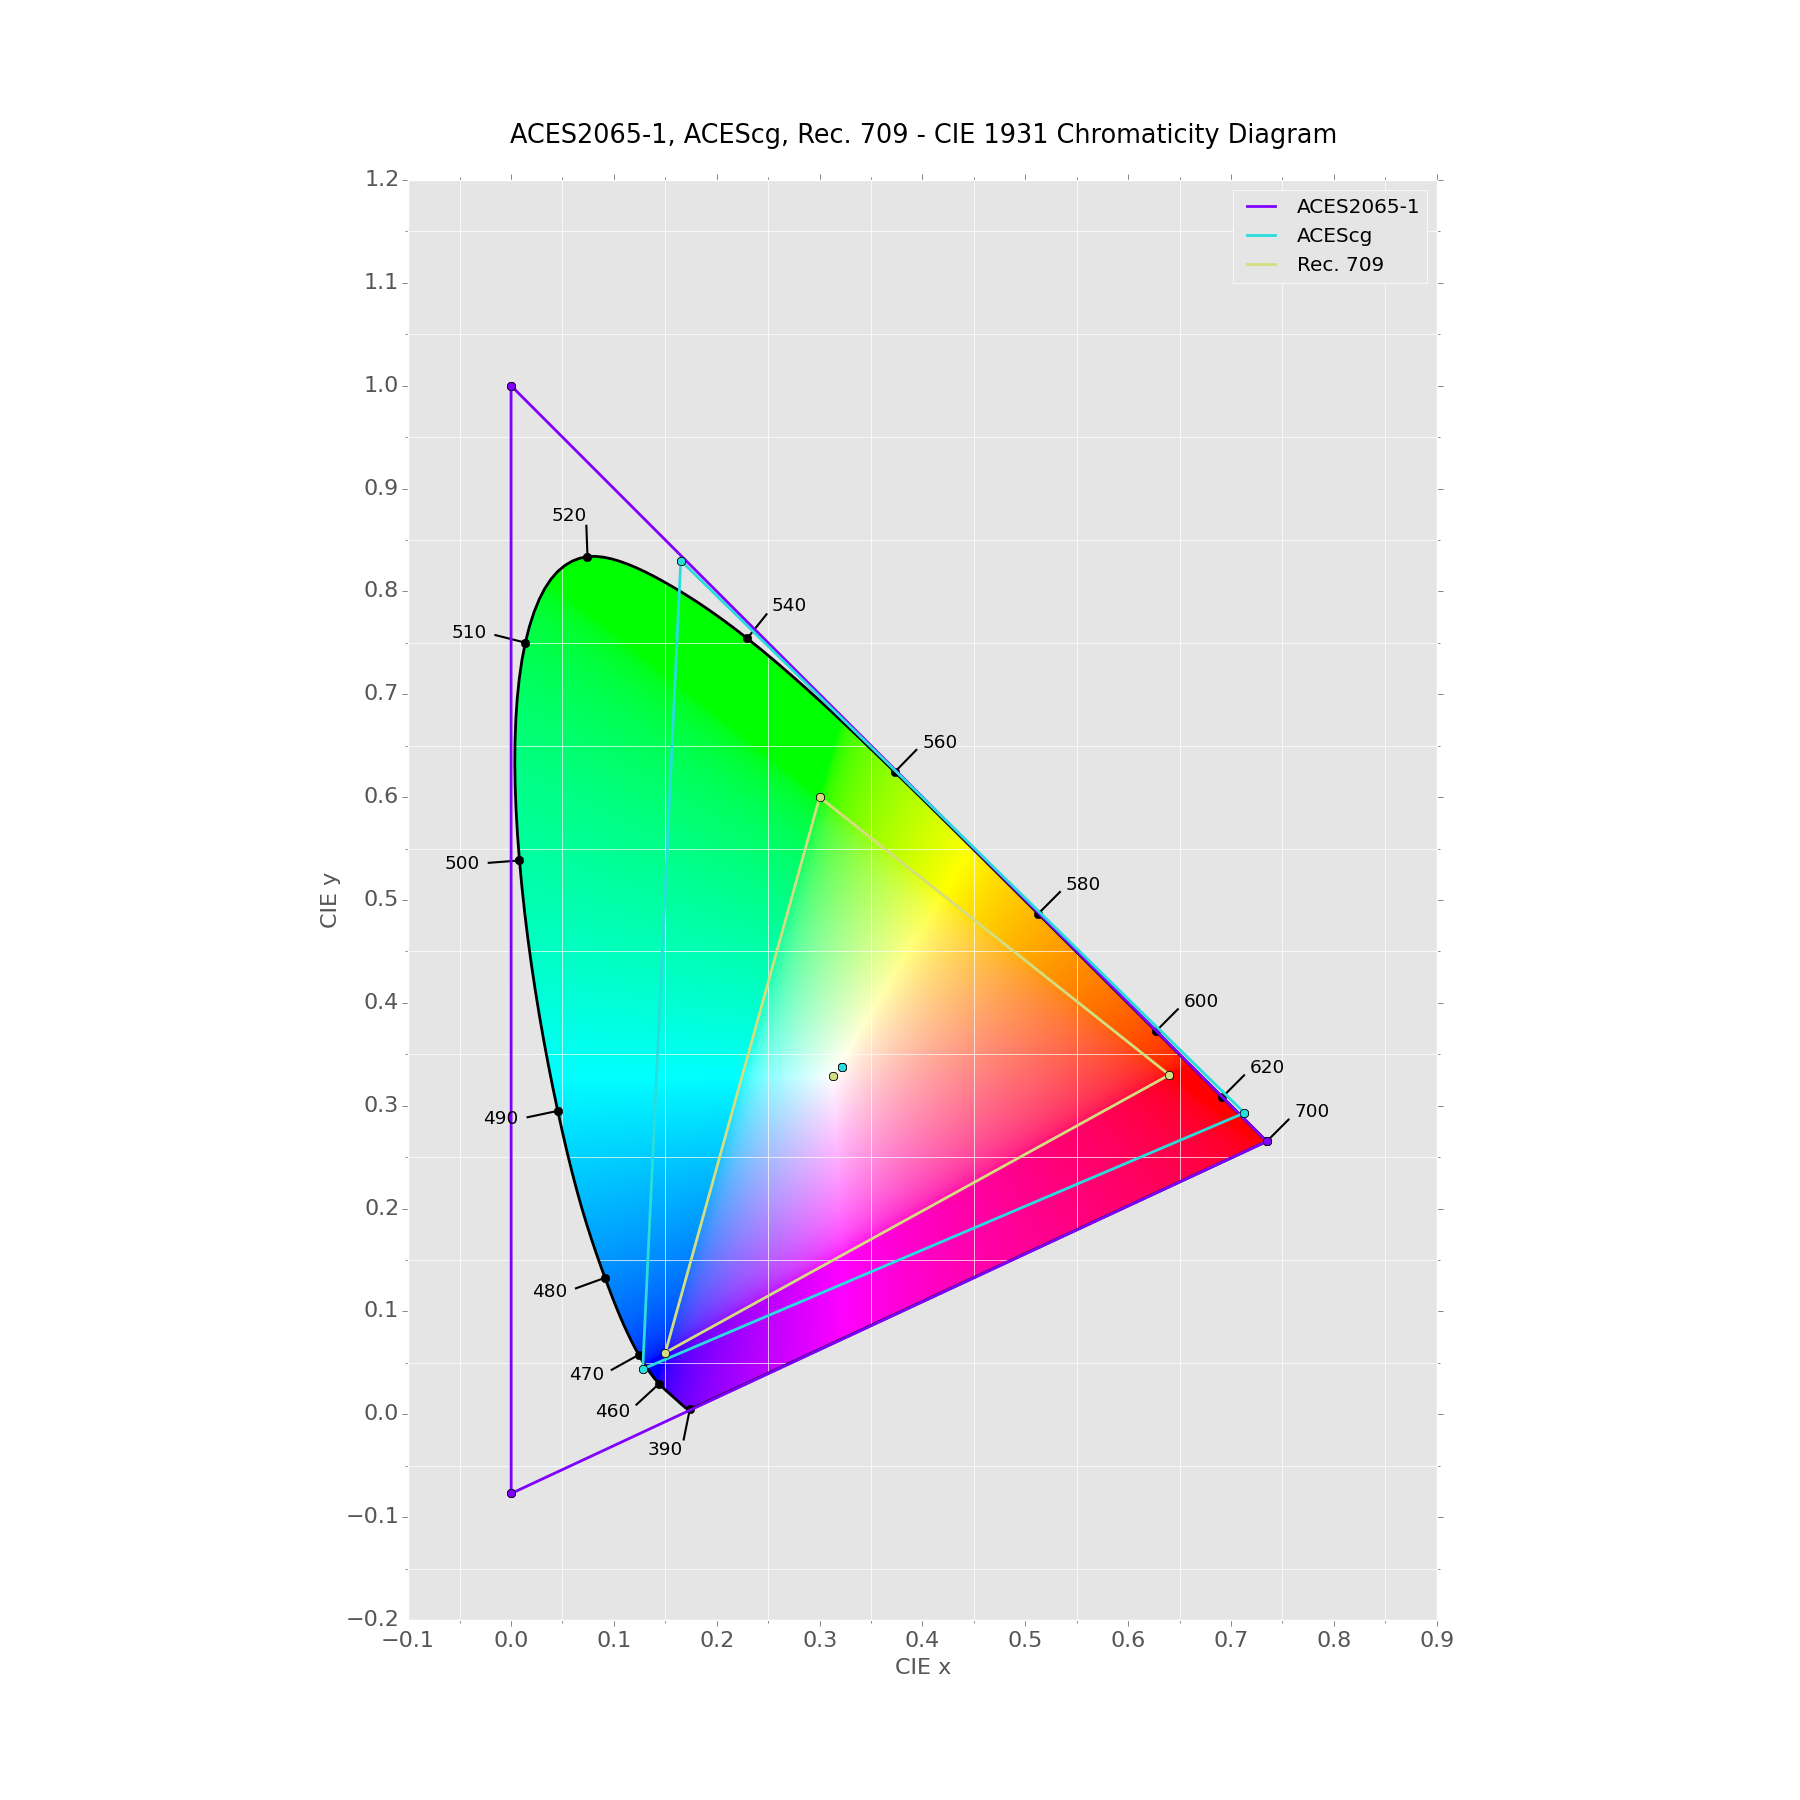
- It is entirely possible to represent the colours of the chromaticity diagram using a wide gamut colourspace such as ACES2065-1, they would not be displayed correctly though because no display exists that can represent such a colourspace.
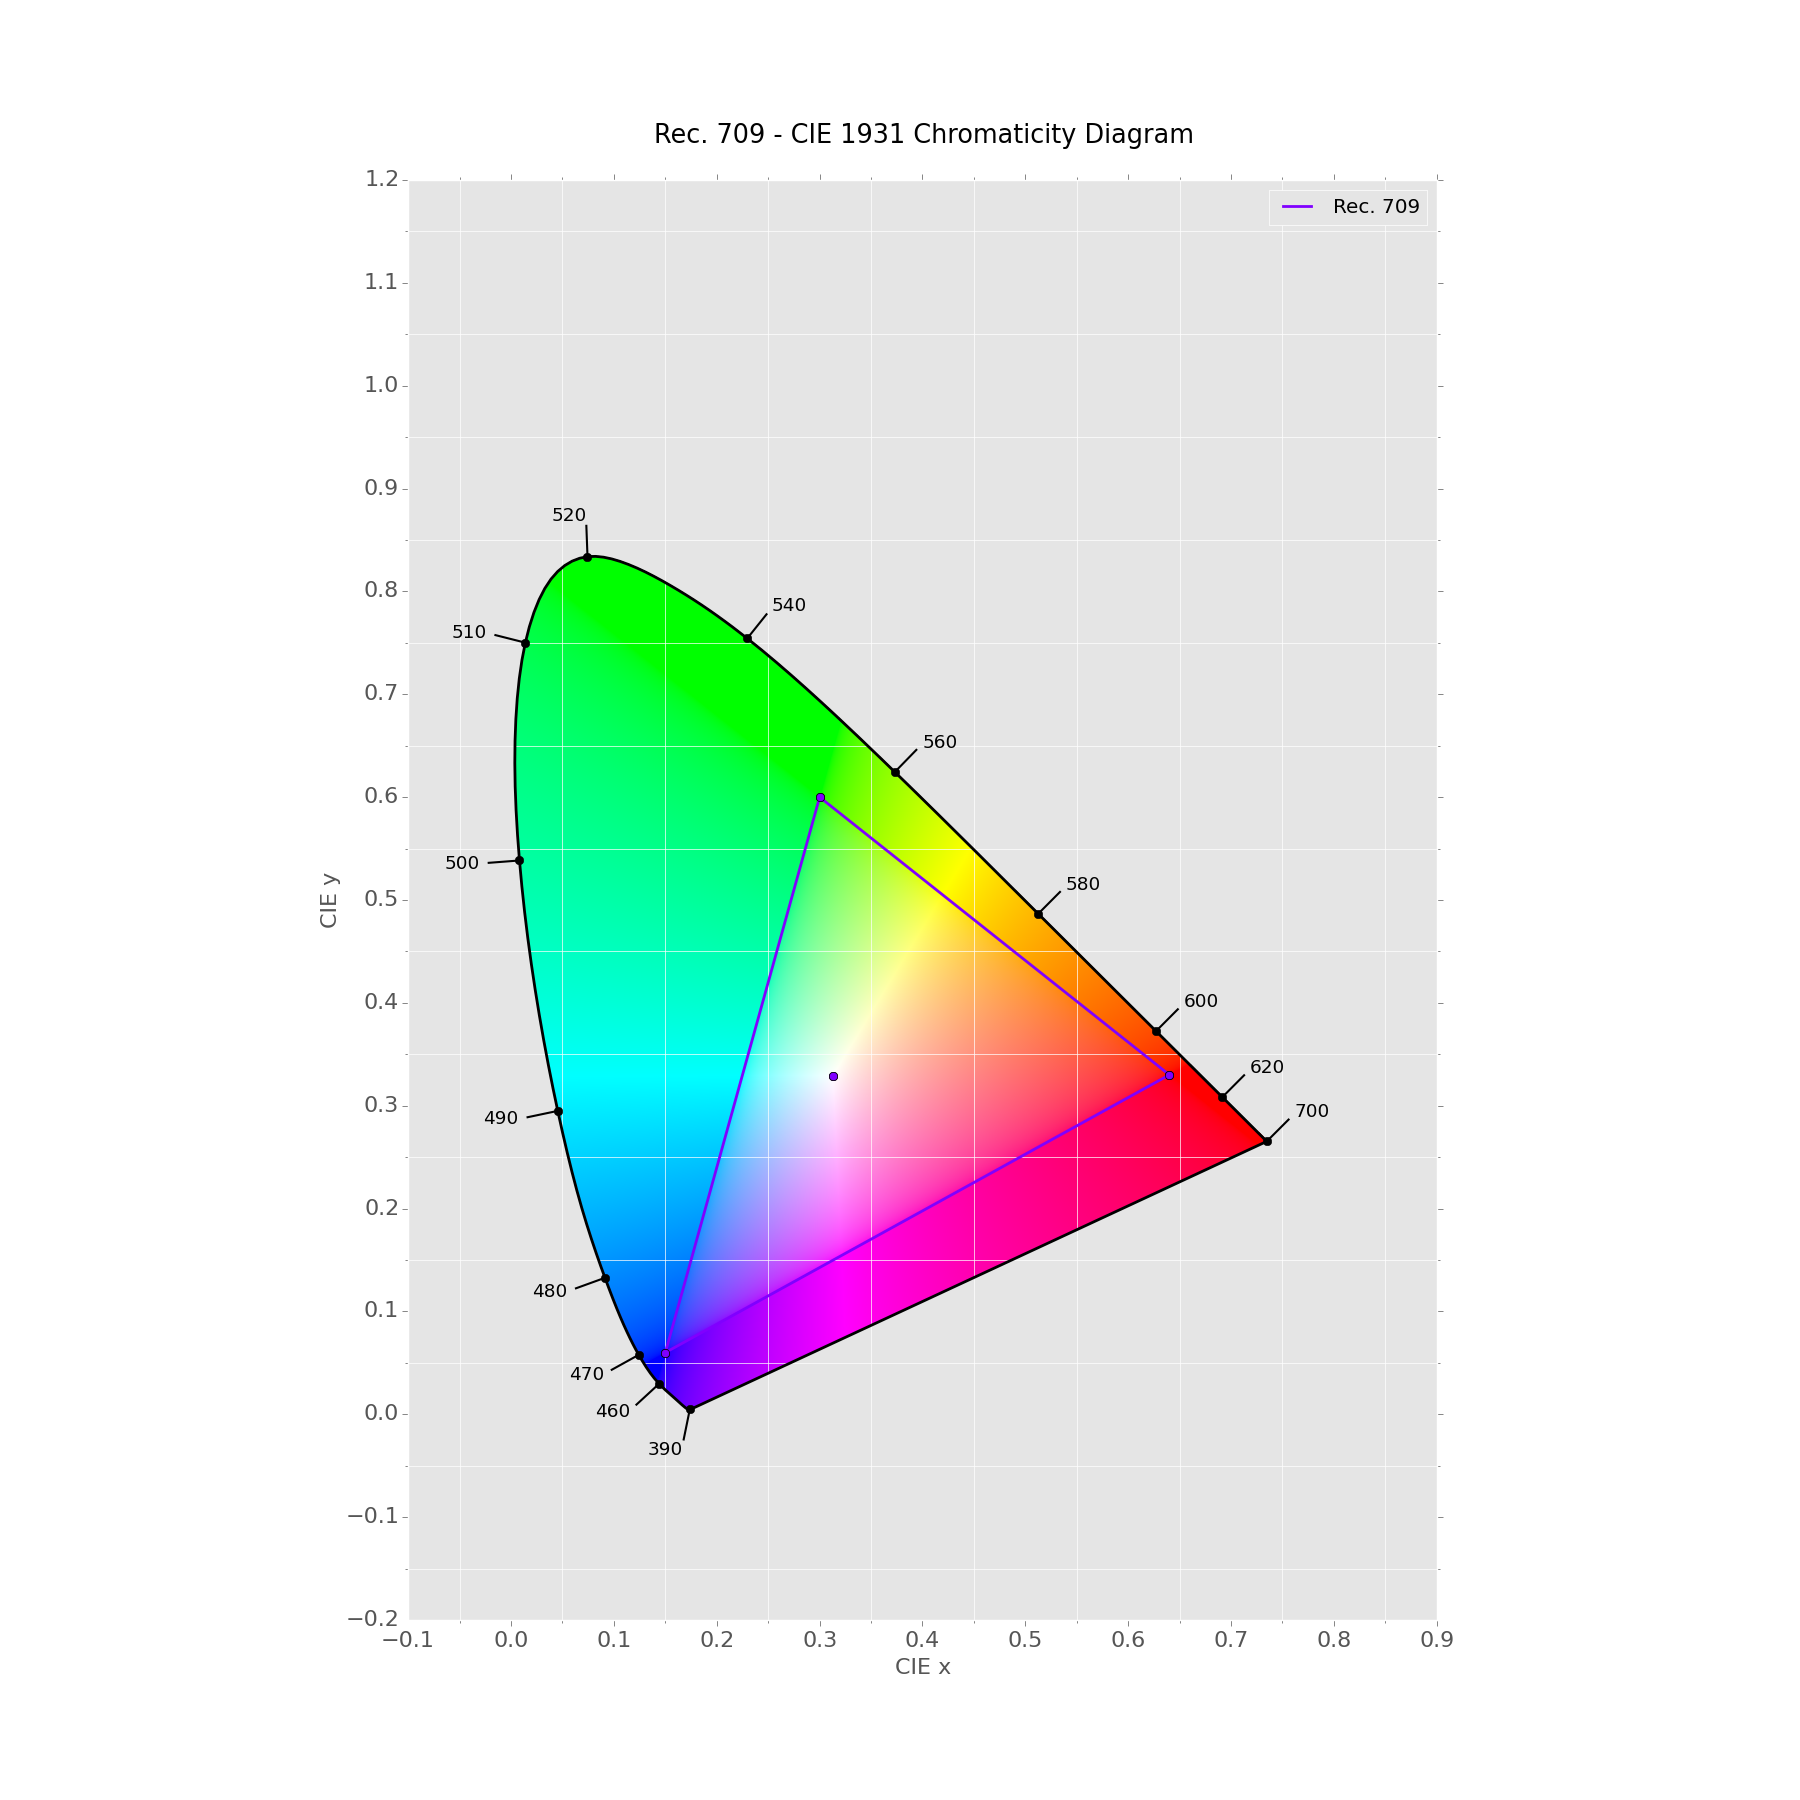
Here is a normalised and clipped chromaticity diagram for sRGB / Rec. 709 colourspace, rendered in sRGB colourspace:

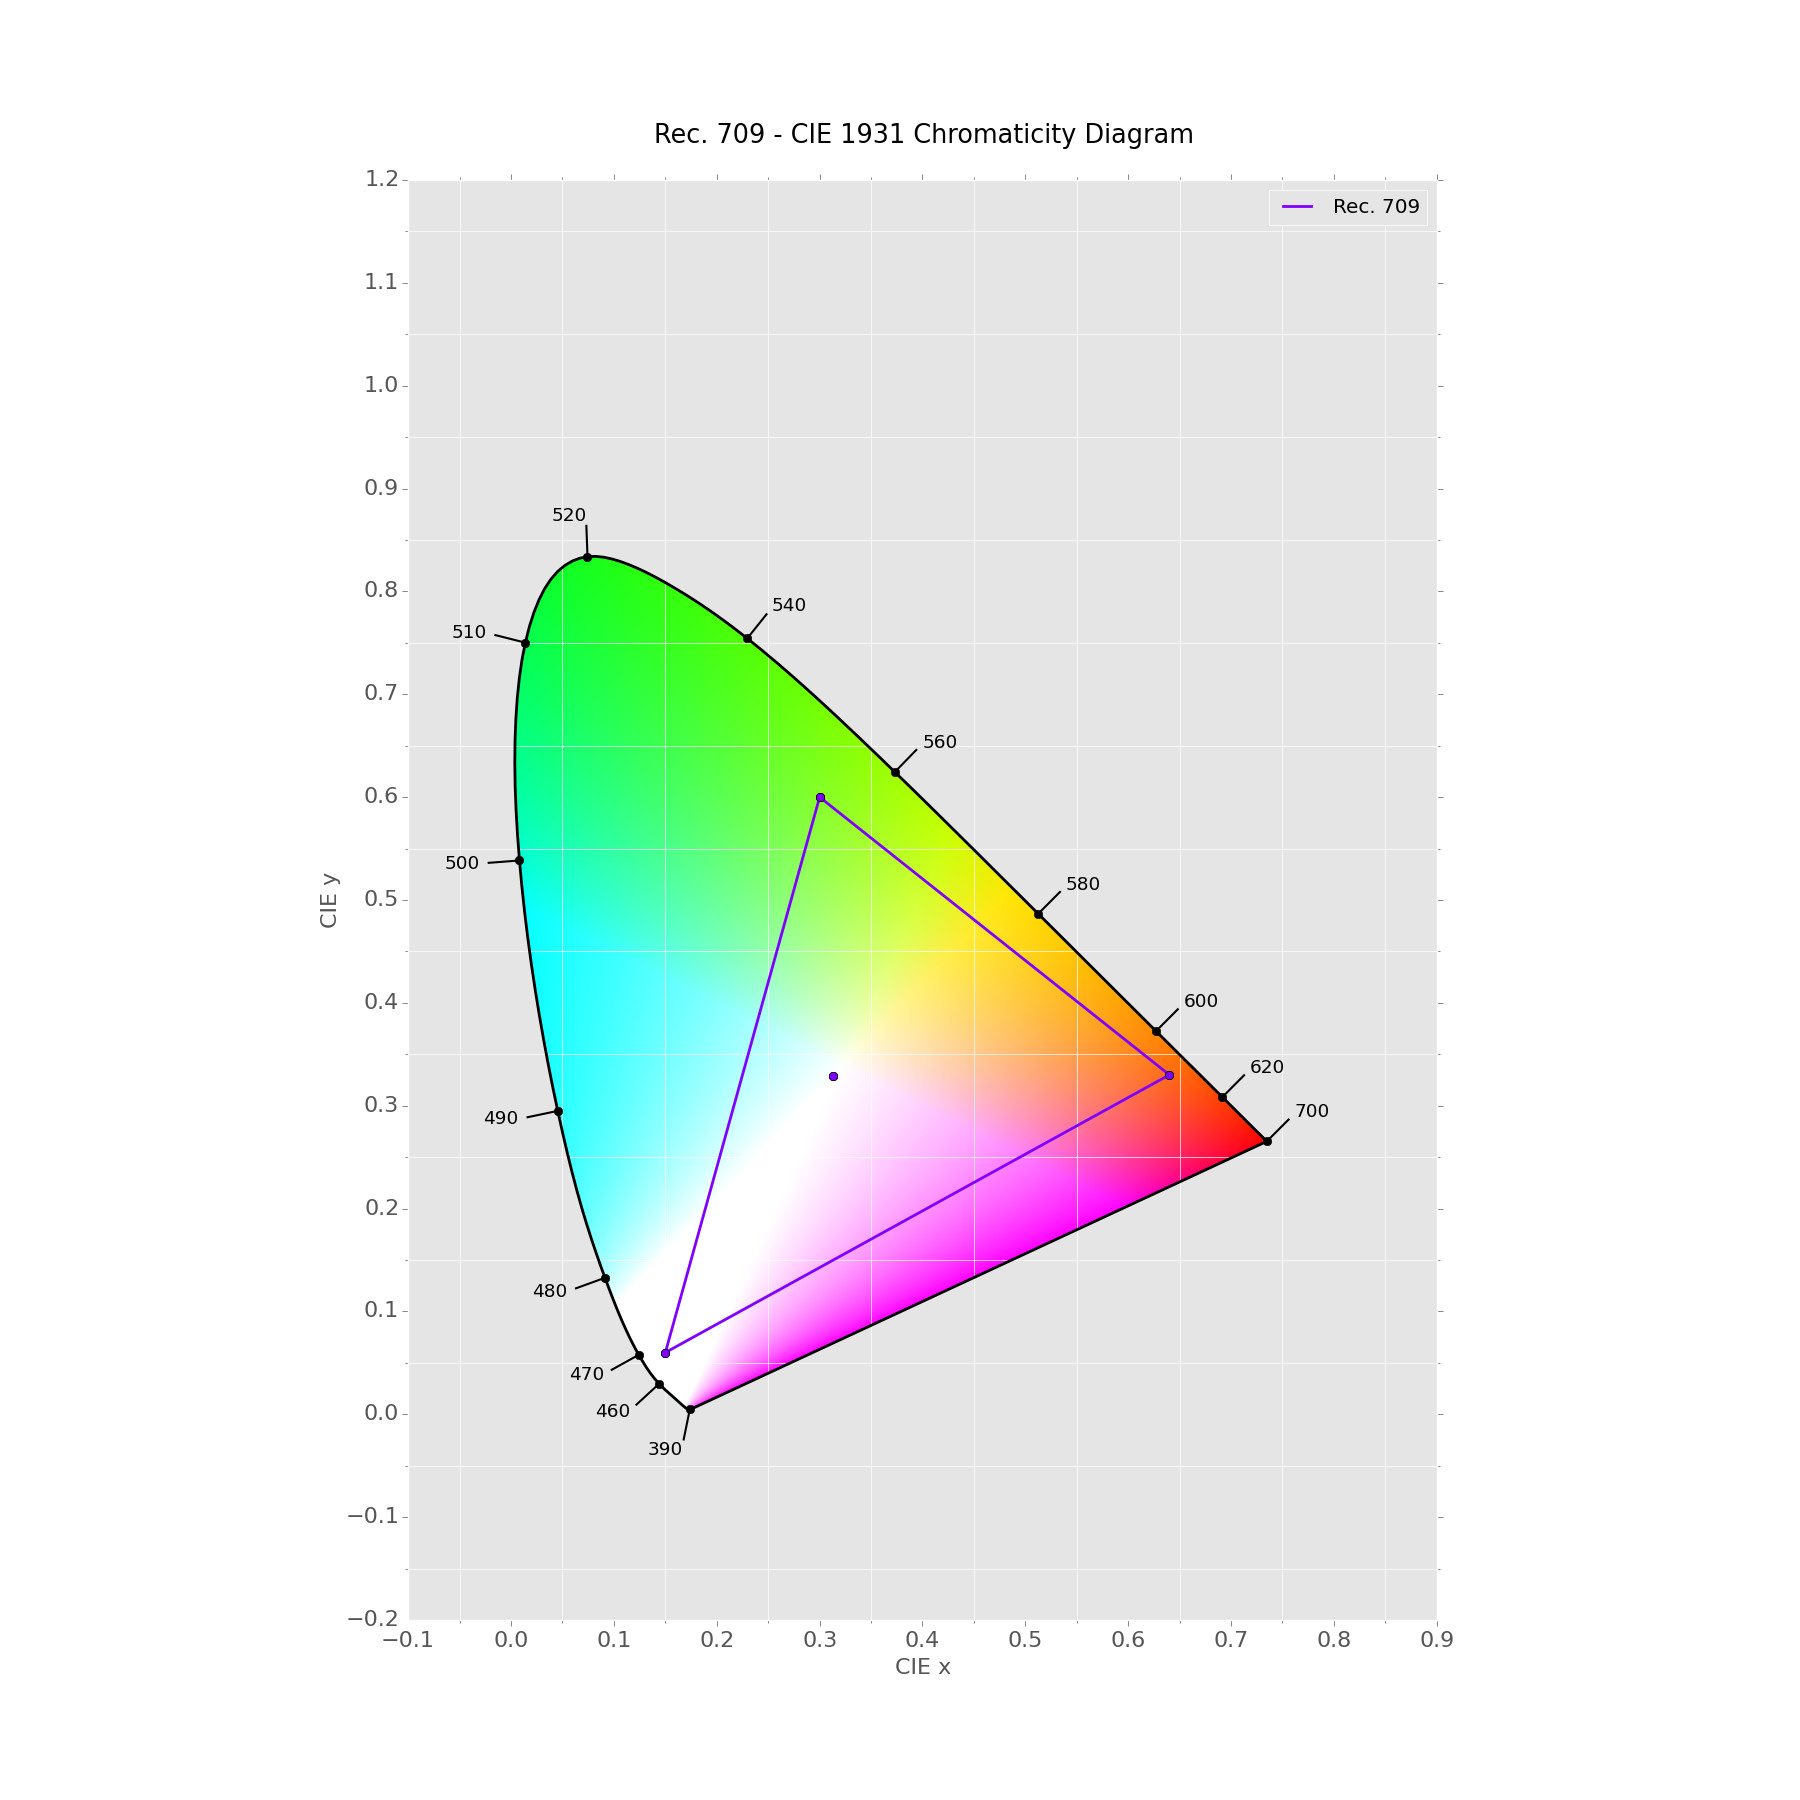
The same as above but this time not normalised but clipped:

And one representing the ACES encodings for reference:


I don't think that's the case, at least not for typical meanings of "typical".A lot displays actually have larger gamut than sRGB / Rec. 709, this is especially true with Rec. 2020 colourspace becoming standard (Rec. 2020 largely encompasses sRGB / Rec. 709). \$\endgroup\$