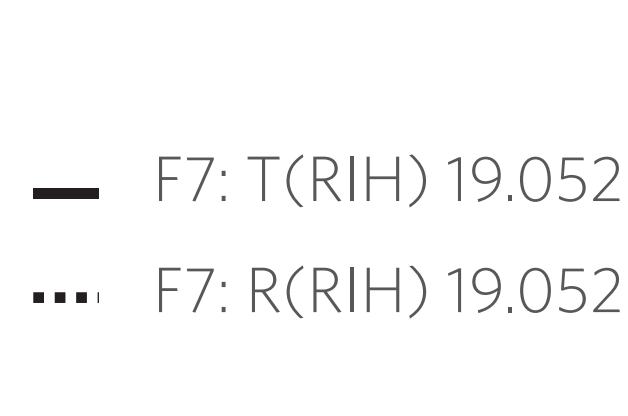
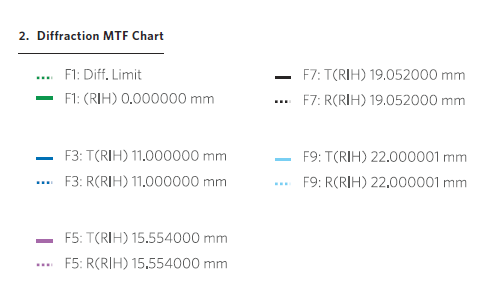
If one looks closely at the document, one can see that it might not be 'RIH' but rather it could be 'R|H' inside each set of parentheses.
Here is a crop of the linked pdf:

And another crop viewed at exactly 100%:

The source document linked in the question is from a company, Lomographische AG, based in Vienna, Austria. The official language of Vienna is German. R|H might be an abbreviation of German words that don't come up in an English google search, but I can find no reference anywhere to 'R|H' or 'RIH' coupled to MTF measurements. Since the size of the measurements are rather large, ranging from 0mm to 11mm to 22mm, and the distance along the diagonal of a 36x24 mm frame from center to corner is 21.633 mm, my guess (assisted by @scottbb's observation) is that the measurement in millimeters is for the distance from the center of the lens' optical axis where it intersects the camera's image plane to where each curve was measured.
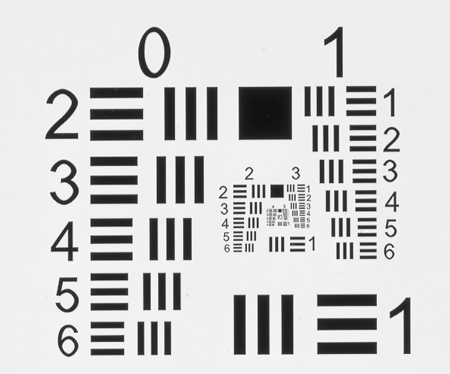
At first I thought it might be the height of a specific test pattern referenced as 'R' (in much the same way as a pattern is presented in various sizes on other charts like the USAF 1951 standard chart), but a closer examination of the charts in linked pdf prove this to be incorrect. If that had been the case, 'R|H' would have been the designation of the height of the various sizes of the 'R' pattern on the test chart used.
USAF 1951 test chart, which uses a number system to designate different sizes of of the same test pattern:

The 'R' or 'T' before each set of parentheses is for 'Radial' (most often called 'Sagittal' in English speaking circles) lines or 'Tangential' (sometimes called 'Meridional') lines (more below).
My thought (is that) an MTF chart would show line/mm curves
The vast majority of MTF charts don't exactly show lines pairs per millimeter (lp/mm) curves. What they show is the degree to which contrast is preserved when an imaging system is used to view a chart with a specific pattern that is a certain number of line pairs per millimeter. Roger Cicala explained it as simply as I've ever seen in a blog entry titled "MTF – The English Translation"
Now I’m going to show you the MTF formula without any math: MTF = contrast. We can make it just a bit more complex and more accurate without getting mathematical: MTF = blackest–whitest/blackest+whitest.
The rest of the blog entry is also well worth reading.
If pure black on the test chart has a value of "1" and pure white has a value of "0", then (1-0)/(1+0)=1. A lens that could maintain the same levels of pure black and pure white would have a theoretically perfect MTF of 1. No such lens exists. If the "black" lines in the image were only 70% of pure black and the "White" lines were 25% black, then the MTF would be (70-25)/(70+25)=0.47. For a more detailed mathematical explanation, please see "Zeiss: How to read MTF Curves." The curves referenced in the paragraph between the two immediately preceding quotes are the type covered on pages 20-23. But they are not the type of curves in the Lomographische AG document.
A "30 mm/lp" curve on a conventional MTF chart shows the contrast produced by a system when the test pattern has a size, as projected onto the image plane of the camera, of 30 lp/mm . The curves show to what degree the contrast between the brighter and darker lines on the test chart is preserved. In general the left side of the chart shows the value measured at the center of the lens and the right side shows the value measured near the edge of the image circle or in the corner of the camera's frame. The curve shows the contrast at each point along the line between the center and image circle edge/corner of the camera frame. A 30 lp/mm value of 0.85 at 40% of the distance from center to edge means that when measured at a distance of 40% from the center to the edge the system produces contrast between the white and black portion of 30 line pairs per millimeter that is 85% of the amount of contrast between each half of the line pairs on the chart itself. A 50 lp/mm value of 0.20 means that the system produces contrast between the white and black portions that has only 20% as much contrast between each half of a 50 lp/mm pattern, and so on.
Please note that "MTF50" is not the same thing as a "50 lp/mm" measurement. It's not even close to the same thing. "MTF50" is a way of measuring how many lp/mm can be imaged while preserving at least 50% of the contrast between the dark and light portions of each line pair. There are charts that show a curve for such a measurement that are usually labeled "MTF by Frequency". The graph has a vertical axis that indicates contrast and a horizontal axis that indicates lp/mm. Such a curve does not show differing contrast along a line from center to edge of the lens' field of view. Rather, such a chart will show the percentage of contrast measured at a single point (usually the center) or will show multiple curves with each curve measured at a particular point between the center and the edge as the number of line pairs per millimeter is increased. MTF30 is a measure of how many lp/mm can be imaged with at least 30% contrast, MTF20 is a measure of how many lp/mm can be imaged with at least 20% contrast, and so on.
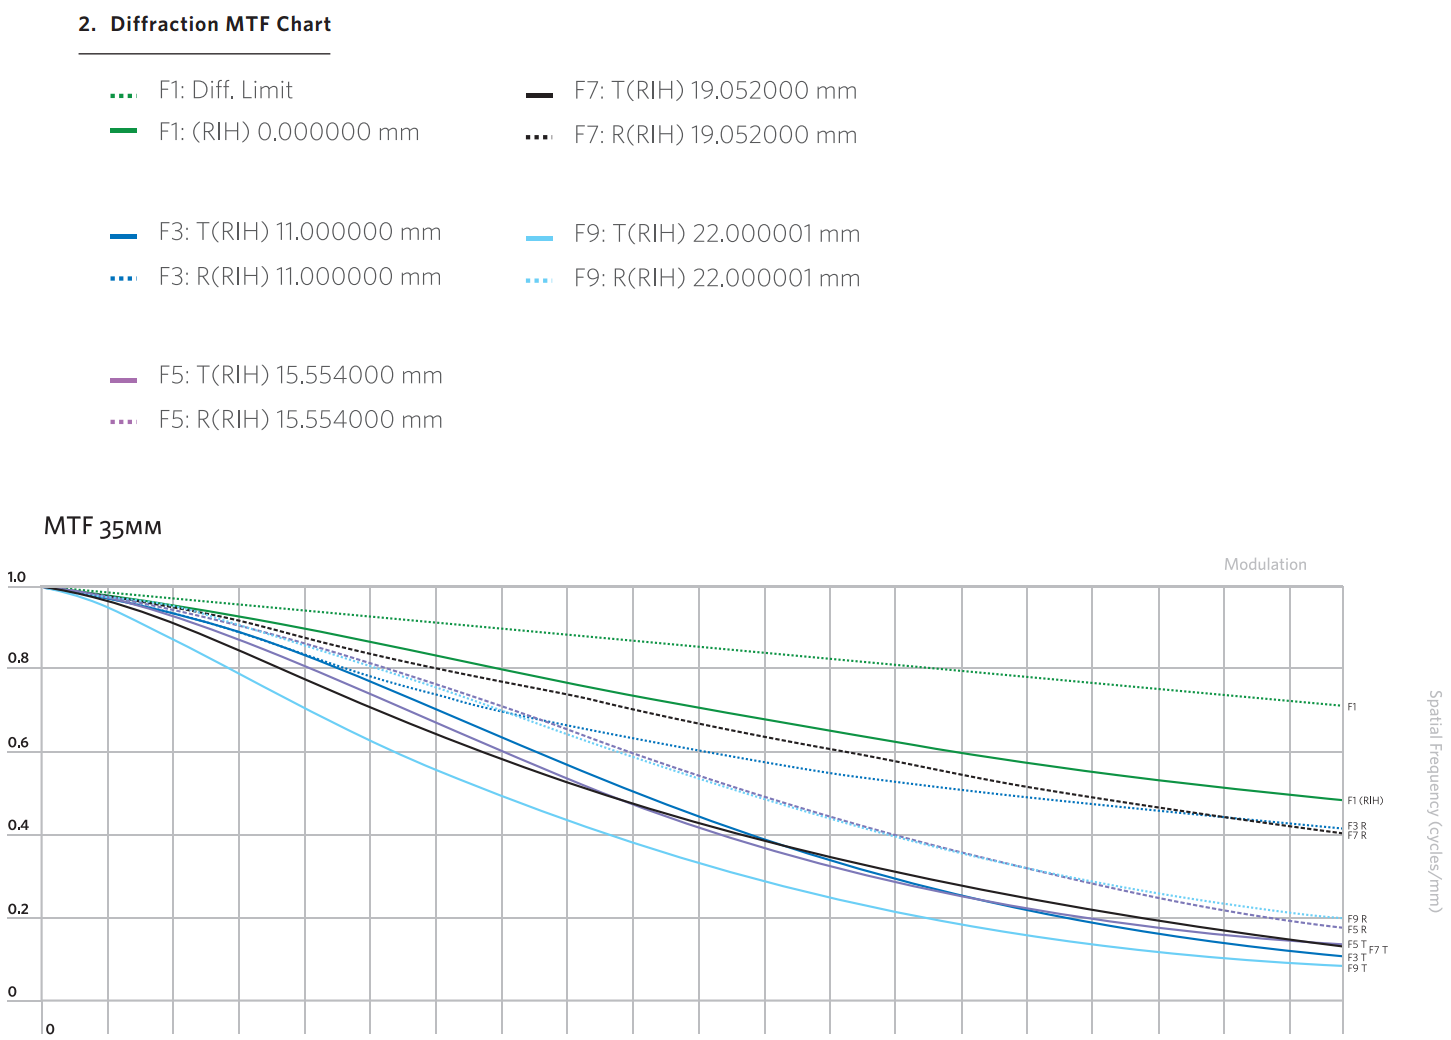
The curves in the Lomographische AG document seem to be this type of "MTF by Frequency" graph. Note the very light "Spatial Frequency (cycles/mm)" printed sideways to the right of each graph which should probably be placed along the x-axis at the top or bottom of the graph to make it clearer that the 0 -- 50 -- 100 scale on the horizontal axis of the graph is a reference to lp/mm and not to percentage of the distance from the center to the edge of the lens circle or camera frame.
With normal MTF measurements, contrast is measured in two directions that are at right angles to one another: sagittal/radial and tangential/meridional. Test charts orient the sagittal and tangential lines with respect to the center of the optical axis. Sagittal lines run along a line drawn from the center to the edge of the frame while tangential lines are at right angles to the sagittal lines. The resulting numbers show the resolution of the parts of a 'wagon wheel' shape where center of the frame is the axle hub, the sagittal lines are the spokes, and the tangential lines are the rim. Zeiss (see page 19 of the linked document) and many other testing labs use this system. Other charts orient the sagittal and meridional lines only with respect to a diagonal line running from the lower left to the upper right of the frame. The sagittal lines run parallel to the diagonal and the meridional lines run perpendicular to the diagonal. Nikon uses this system for their in-house MTF charts. Note that along the diagonal described above, both systems are the same. But the system used by Nikon measures only along this diagonal, while the system used by most everyone else also measures along other lines that pass through the center and averages the results from each line. Also note that most manufacturers publish "theoretical" MTF charts that are not measurements of actual lenses but rather what MTF a theoretically perfect copy of the lens design in question would have. In the case of symmetrical lens designs the theoretical MTF of a perfect copy of the lens design would be the same along any line that passes through the center of the frame.
Many charts show multiple curves. Each curve can be for a varying line pair frequency or line pair height/width as the image is tested from the center to the edge of the frame or each curve can be for the amount of contrast preserved at a single point as the number of lp/mm is increased. The charts in the Lomographische AG document linked in the question shows five such sets of the latter type of curves. There is a tangential and radial curve for each of four of the sets. Each set of Tangential and Radial curves seem to have been measured at a distance from the center of the frame designated by the distances indicated in F3, F5, F7, and F9. Since F1 was measured at the center there is neither a Tangential nor a Radial orientation to either of the lines. F1: Diff. limit seems to be an MTF curve for a theoretically perfect diffraction limited lens with the designated focal length. F1: (R|H) seems to be the measured contrast at the center of the frame for the number of lp/mm on the scale across the horizontal axis of the chart.
The (R|H) values for the Tangential and Radial lines are expressed in millimeters from the center of the frame. F3: T (R|H) 11.000000 mm is the Tangential measurement taken at 11 mm from the center of the frame. The left side of the graph starts at 0 lp/mm and the right side of the graph ends at 100 lp/mm. F9: R (R|H) 22.000001 mm is the Radial (Sagittal) measurement taken at 22mm from the center of the frame. Since half the diagonal of a 36x24mm full frame sensor is 21.633 mm from the center of the frame to the very corner, F9 appears to have been measured on the lens' image circle at a point just past the part that would fall on the very corner of a 35mm film frame or a full frame sensor.


