3
\$\begingroup\$

I'm trying to reproduce MTF chart programmatically but I'm stuck at some point.

I'm starting with a clean bar chart like this: enter image description here

I then take a picture of this pattern with a smartphone (printed on HD quality paper, no gloss, no texture, ...) and I get something like this: (there is a big of distortion) enter image description here

I used the following page to understand how MTF is calculated: https://www.imatest.com/docs/sharpness/

With my script, I'm basically scanning all vertical lines one by one, I scan pixels one by one from top to bottom for each line and I get the min and max value for luminance (I get the LAB value for each picture and I take the "l" value).

For the first step (amplitude), I get the following graph for my "perfect" example: enter image description here
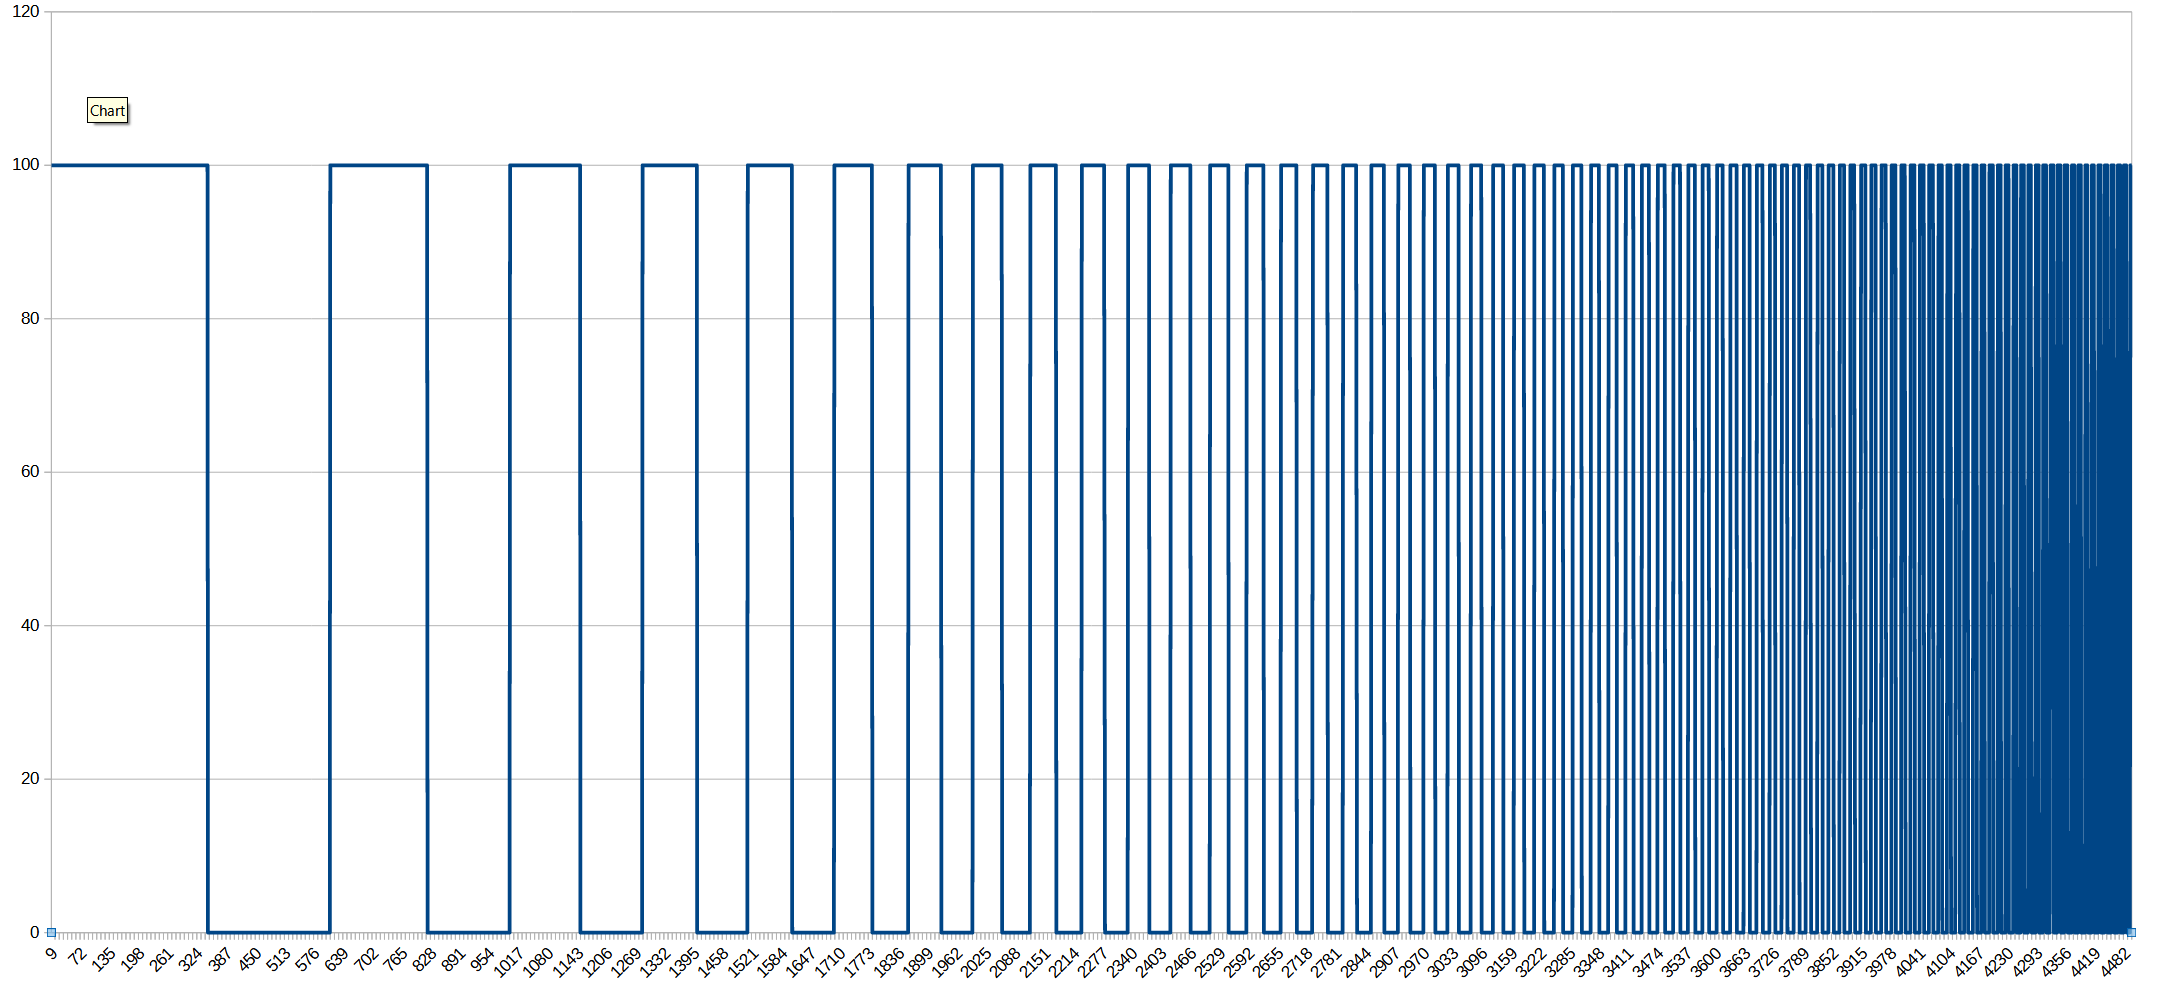
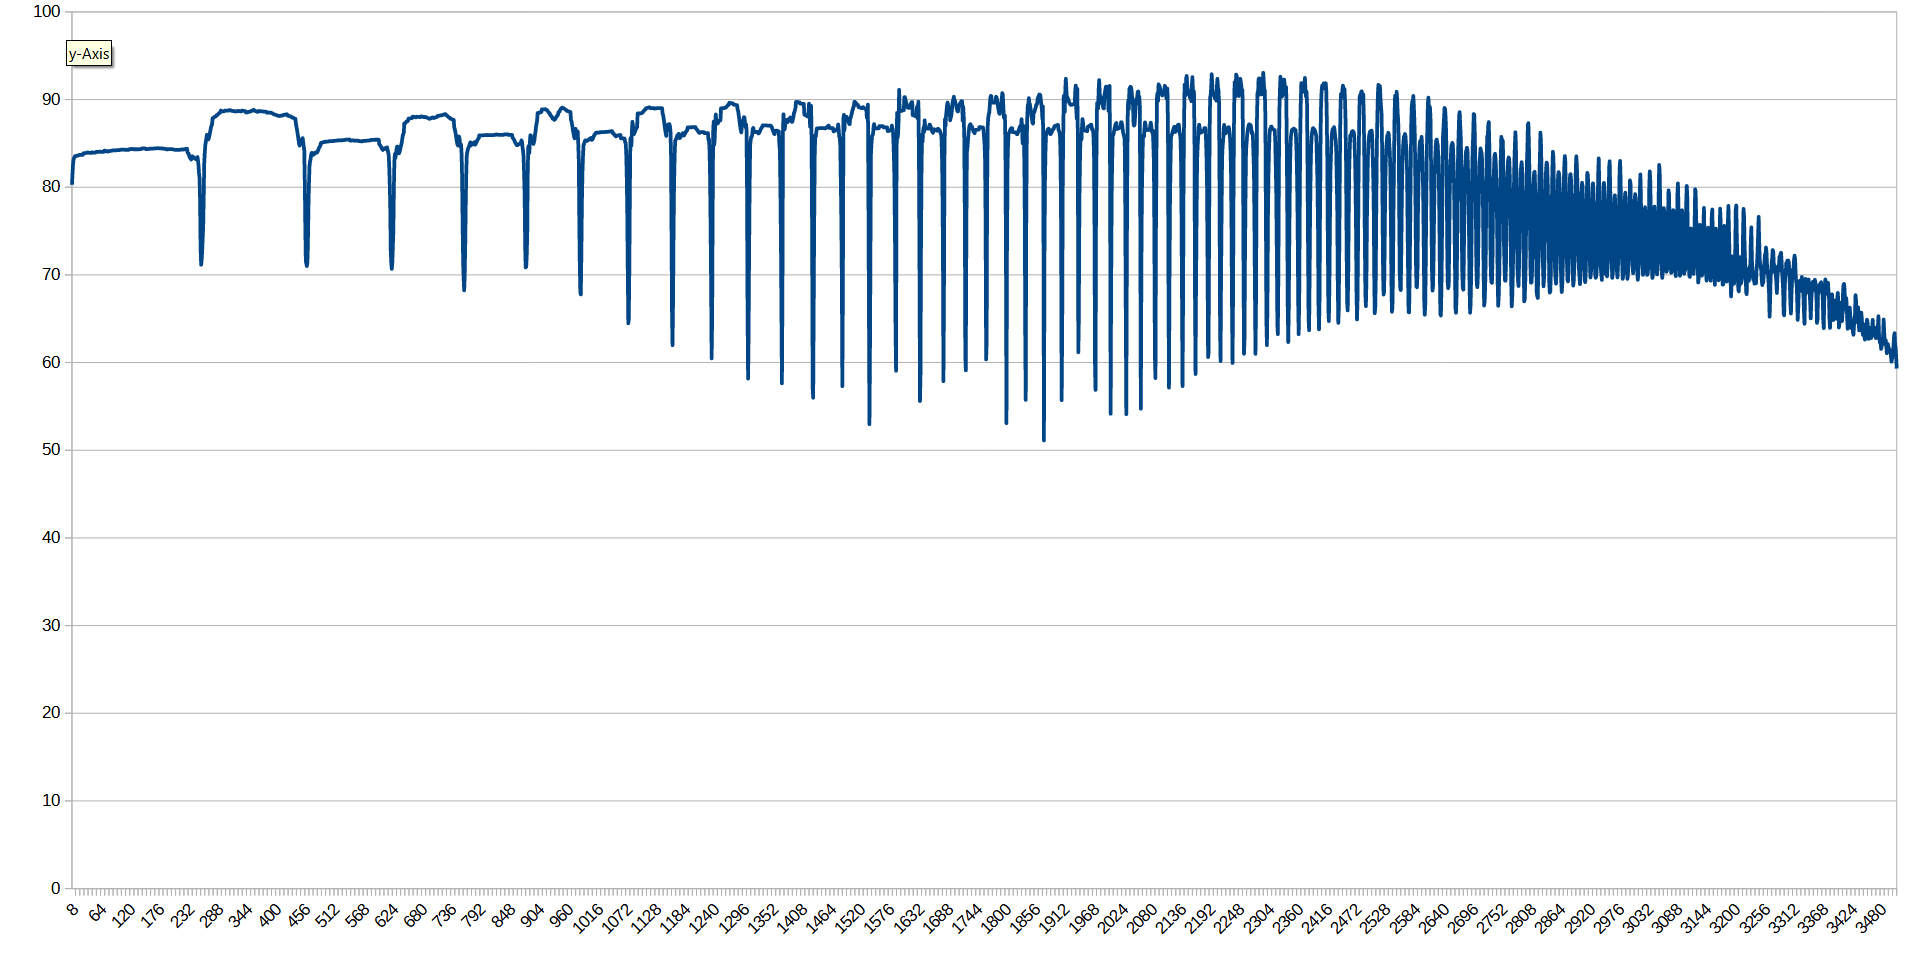
And when I do the same with the picture I took, I get something like this:

enter image description here

So far, it seems to be in line with what I see on the Imatest page except that my values seem inverted and that I go above 100 while I only apply the following formula: C(f)=Vmax−Vmin/Vmax+Vmin

Now my problem is that I can't get to the MTF formula, if I apply MTF(f)=100%×C(f)C(0), I get exactly the same graph. My maths are rusty and maybe I'm missing something somewhere.

What I'm trying to achieve is to give a easy to understand score to sharpness. MTF is a good starting point but in the end, I would like to give a score like an average. I know it's not accurate because the center is sharper than the edge but at least it would allow to rank sharpness in a more or less neutral way.

Any idea on how I can build the MTF chart or how I could assign a final score?

Thanks

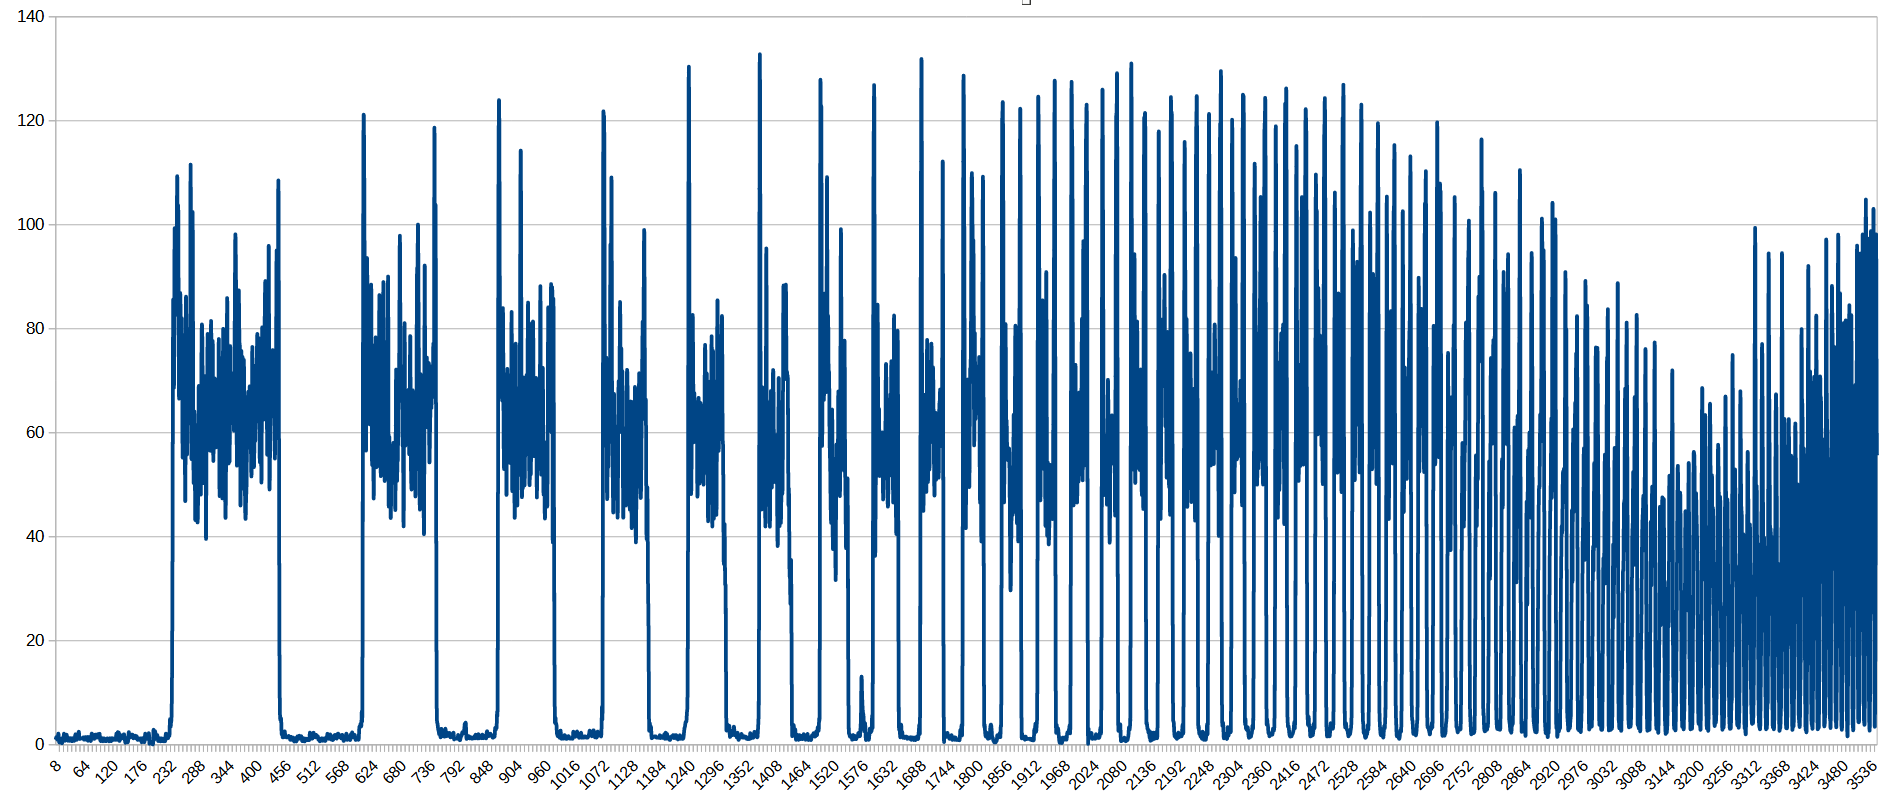
Update, based on Steven's comment hereunder, I have built an average MTF curve and it looks like this: enter image description here
Am I right to assume that this indicates oversharpening caused by the device software starting somewhere in the middle and then gradually losing sharpness?

\$\endgroup\$
4
  • \$\begingroup\$ I flagged this question to be in another site, like stackexchange or maths (ov even physics). Even if it is a question related to photography, it relies more on other topic like programming. I hope it helps anyway \$\endgroup\$
    – spund3
    Commented Jun 7, 2021 at 19:08
  • 3
    \$\begingroup\$ @spund3 please don't :) users of the other forum know how to develop but that's not the point here, I need experts in photography to explain how I can translate the MTF formula. Thanks. \$\endgroup\$
    – Laurent
    Commented Jun 7, 2021 at 19:13
  • \$\begingroup\$ sorry, my bad, I was trying to help. I'm still thinking that pysics might be a good place to ask this Q if you don't get help here \$\endgroup\$
    – spund3
    Commented Jun 7, 2021 at 19:14
  • 1
    \$\begingroup\$ @spund3 ok, no problem :) I'll give it a try if I don't get answers from here. \$\endgroup\$
    – Laurent
    Commented Jun 7, 2021 at 19:15

2 Answers 2

1
\$\begingroup\$

From my previous comment to your previous question:

Horizontal and vertical bars do not, strictly speaking, measure tangential and sagittal performance. Sagittal lines are like the spokes of a wheel spreading out from the center of the lens' field of view. Tangential lines are tangent to the circular surface of the wheel that rolls over the ground.

Further, matte paper is notorious for blurring sharp edges. You're starting with a poor quality chart. All that follows will suffer the consequences for that decision. There's a reason real test charts are expensive. They're held to very high standards of quality control and use more expensive printing methods to achieve them.

\$\endgroup\$
2
  • \$\begingroup\$ Thanks! I also have a pattern like the ones used by Imatest but I wanted to start simple to develop the script first. I was not aware about the matte paper but I had it printed by a specialized company and even when looking with a magnifying glass, it looks very sharp to me. So you're saying that simple bars will not give a reliable indication of sharpness? \$\endgroup\$
    – Laurent
    Commented Jun 8, 2021 at 6:45
  • \$\begingroup\$ I forgot to add that MTF is not my final goal, I'd like to come to a simple figure that would indicate how sharp a smartphone camera can be. The fact that is sharper in the middle and softer on the edge is interesting but I'd like to find an average. It doesn't need to be scientifically accurate. \$\endgroup\$
    – Laurent
    Commented Jun 8, 2021 at 6:51
0
\$\begingroup\$

Now my problem is that I can't get to the MTF formula, if I apply MTF(f)=100%×C(f)C(0), I get exactly the same graph.

From the Imatest page (emphasis added):

"To correctly normalize MTF at low spatial frequencies, a test chart must have some low-frequency energy. This is supplied by large light and dark areas in slanted edges and by features in most patterns used by Imatest, but not satisfied by lines and grids."

\$\endgroup\$
6
  • \$\begingroup\$ Thanks. What I was trying to do is a step by step approach to fully understand what I was doing instead of copy/pasting things I don't understand. Imatest also started with simple vertical bars and got a first MTF chart out of this. That would be my first objective. I also have a slanted edge pattern but as it's going to be more complicated, I wanted to start with bars. \$\endgroup\$
    – Laurent
    Commented Jun 8, 2021 at 6:47
  • \$\begingroup\$ They did not get an MTF chart, they got an MTF curve from it. If you averaged your samples/area your curve result would start at ~70, quickly decline to 60, hold 60 for quite a while, and dive to 50 right around X3000 (50 being 0 contrast/MTF). At that point it seems to invert, which I would assume means noise or false data (camera software generated). \$\endgroup\$ Commented Jun 8, 2021 at 13:19
  • \$\begingroup\$ Thanks, I'll try to use the average to see if I can get to a similar curve. The curve going back up is something I have noticed on some camera, it looks like some smarphone try to artificially increase sharpness on some areas, it's clearly something artificial. \$\endgroup\$
    – Laurent
    Commented Jun 8, 2021 at 15:44
  • \$\begingroup\$ I have used the average and I'm now getting closer to the MTF curve, it's still erratic but the picture I'm analysing is less sharp and uniform than the one used by Imatest. I try my test samples with Imatest demo and I also seen that sharpness increases above 1 slightly after the center due to oversharpening. Can I conclude that my curve is getting closer to a real MTF chart or could it be just a coincidence? \$\endgroup\$
    – Laurent
    Commented Jun 8, 2021 at 20:24
  • \$\begingroup\$ I don't understand how you made the averaged graph... it doesn't look right to me at all. And it kind of looks like the relevant curve/data points follow along the bottom... i.e. from 70 down to 50 at ~ X2000? \$\endgroup\$ Commented Jun 9, 2021 at 12:01

Your Answer

By clicking “Post Your Answer”, you agree to our terms of service and acknowledge you have read our privacy policy.

Not the answer you're looking for? Browse other questions tagged or ask your own question.