4
\$\begingroup\$

Where can I get a good chart to measure dynamic range?

This would probably be a plastic or cardboard which would show stripes of different reflectance in small increments, preferably 1/4 EV or smaller. Something like a gradient but with a known tonal-range.

Already got color-charts, grey cards, white-balance cards, but this one has been eluding me!

\$\endgroup\$
1
  • \$\begingroup\$ labnut,can the test chart TE240 measure the dynamic range of phone camera? \$\endgroup\$
    – petalse
    Commented Aug 3, 2012 at 2:12

3 Answers 3

6
\$\begingroup\$

The standard way of testing the dynamic range of your camera is to use the Stouffer step wedge.
You can see their price list here.

But, you can do it yourself pretty accurately without spending any money.
Here is the result of a test I did myself:
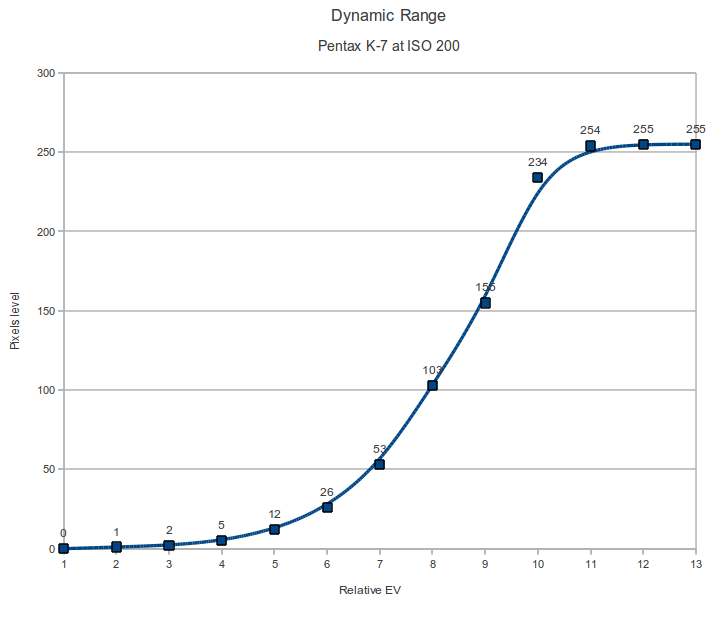
enter image description here

The procedure in outline is this:

  • use a uniform white wall (or similar surface) as a target.
  • put your camera on a tripod.
  • take a photo to get your starting exposure. All your photos must be taken in RAW mode. You should get a mid grey image.
  • now set your camera to manual exposure.
  • take a series of photos at decreasing EV steps until you have pure black, add one for good measure. You will probably need at least six photos.
  • take a series of photos at increasing EV stops until you have pure white. Add one for good measure. You will probably need at least six photos.

Now that you have your photos you will analyse them as follows

  • open the first one in Ufraw (or similar RAW converter)
  • set exposure to default, input curve to linear, output curve to linear, choose no profile, choose manual white balance and adjust to neutral.
  • Under live histogram you will see the average RGB levels for the entire image. Take the average of the RGB values and use that as the average brightness of the image.
  • repeat for all photos in this set
  • you will now have sets of relative EV values paired with average brighness values.
  • plot them on a graph as I have done above.
  • this will give an accurate indication of the dynamic range.

The main limitations on the accuracy of this procedure is the accuracy of your shutter speed and aperture. You will see this effect as small deviations from an ideal curve. For better resolution you can do the test at half stop intervals.

Take all photos in a short enough time that changes in ambient light have no effect.

\$\endgroup\$
3
  • \$\begingroup\$ Looks like I was searching for the wrong keywords! The first sentence of your answer is probably what I need. Looks like they go to 13-stops (41-step @ 1/2 - 4110) so I they do not offer precision and a wide range, it's either-or. I'll wait a bit more to see if someone finds a solution that covers more range more precisely. \$\endgroup\$
    – Itai
    Commented Apr 8, 2011 at 17:21
  • \$\begingroup\$ @Itai, as far as I know that is pretty much the state of art. After that the measurement procedure I described comes into its own. \$\endgroup\$
    – labnut
    Commented Apr 8, 2011 at 18:11
  • \$\begingroup\$ I'm not sure the terminology is being used correctly here - what you posted is not a graph of dynamic range, it's a graph of sensor response versus light level. Dynamic range is the difference between the saturation point and the noise floor, it's represented by a single number, not something you can represent graphically. It sounds like Itai is trying to measure the tonal range, i.e. the number of discrete values the camera can sense. \$\endgroup\$
    – Matt Grum
    Commented Aug 3, 2012 at 9:48
4
\$\begingroup\$

Printed paper has a pretty small dynamic range (the numbers I've seen are 5-7 stops), much less than a decent camera, and you'd have to be very careful about the illumination of the reflective chart, in terms of uniformity and specular reflections. So camera dynamic range is usually measured with a backlit, transmissive step wedge. Even the one I linked to is only about 10 stops or so, so you might have to do a couple of different exposures and "chain" them together.

\$\endgroup\$
1
  • \$\begingroup\$ Good point about paper. I guess chaining is not too hard but I'll look for a one-step solution a bit more. Thanks! \$\endgroup\$
    – Itai
    Commented Apr 8, 2011 at 17:23
3
\$\begingroup\$

Are you trying to measure just the dynamic range, or the tonecurve / response curve of the sensor? If you just want to know dynamic range then you don't need a chart, simply find the saturation point (what exposure yields fully saturated sensels under constant lighting) then reduce the exposure time until you can no longer make out details and are left with an image of noise. Then calculate the ratio in these times (log base 2 if you want your answer in stops).

If "until you can no longer make out details" sounds a bit vague and non-scientific to you that's because the definition of dynamic range is vague and non-scientific! Most benchmark sites use a noise threshold to determine when "you can no longer make out details". Different thresholds lead to different recordings of dynamic range (and arguments on internet forums!)

\$\endgroup\$

Your Answer

By clicking “Post Your Answer”, you agree to our terms of service and acknowledge you have read our privacy policy.

Not the answer you're looking for? Browse other questions tagged or ask your own question.